
50 Years of U.S. Home Sales and Mortgage Rates: Why Today's Slow Market Isn't a Crash
If you've been watching the housing market and wondering whether things are as bad as the headlines suggest, here's a useful answer: 2025 was a slow year, but it wasn't anywhere close to the worst on record.
In 2025, Americans bought about 4.06 million existing homes, essentially the same as 2024 and the lowest total since 1995. That sounds alarming until you zoom out. Sales in 1982 were less than half that number, and the market recovered. So did it after 1991, and again after 2011.
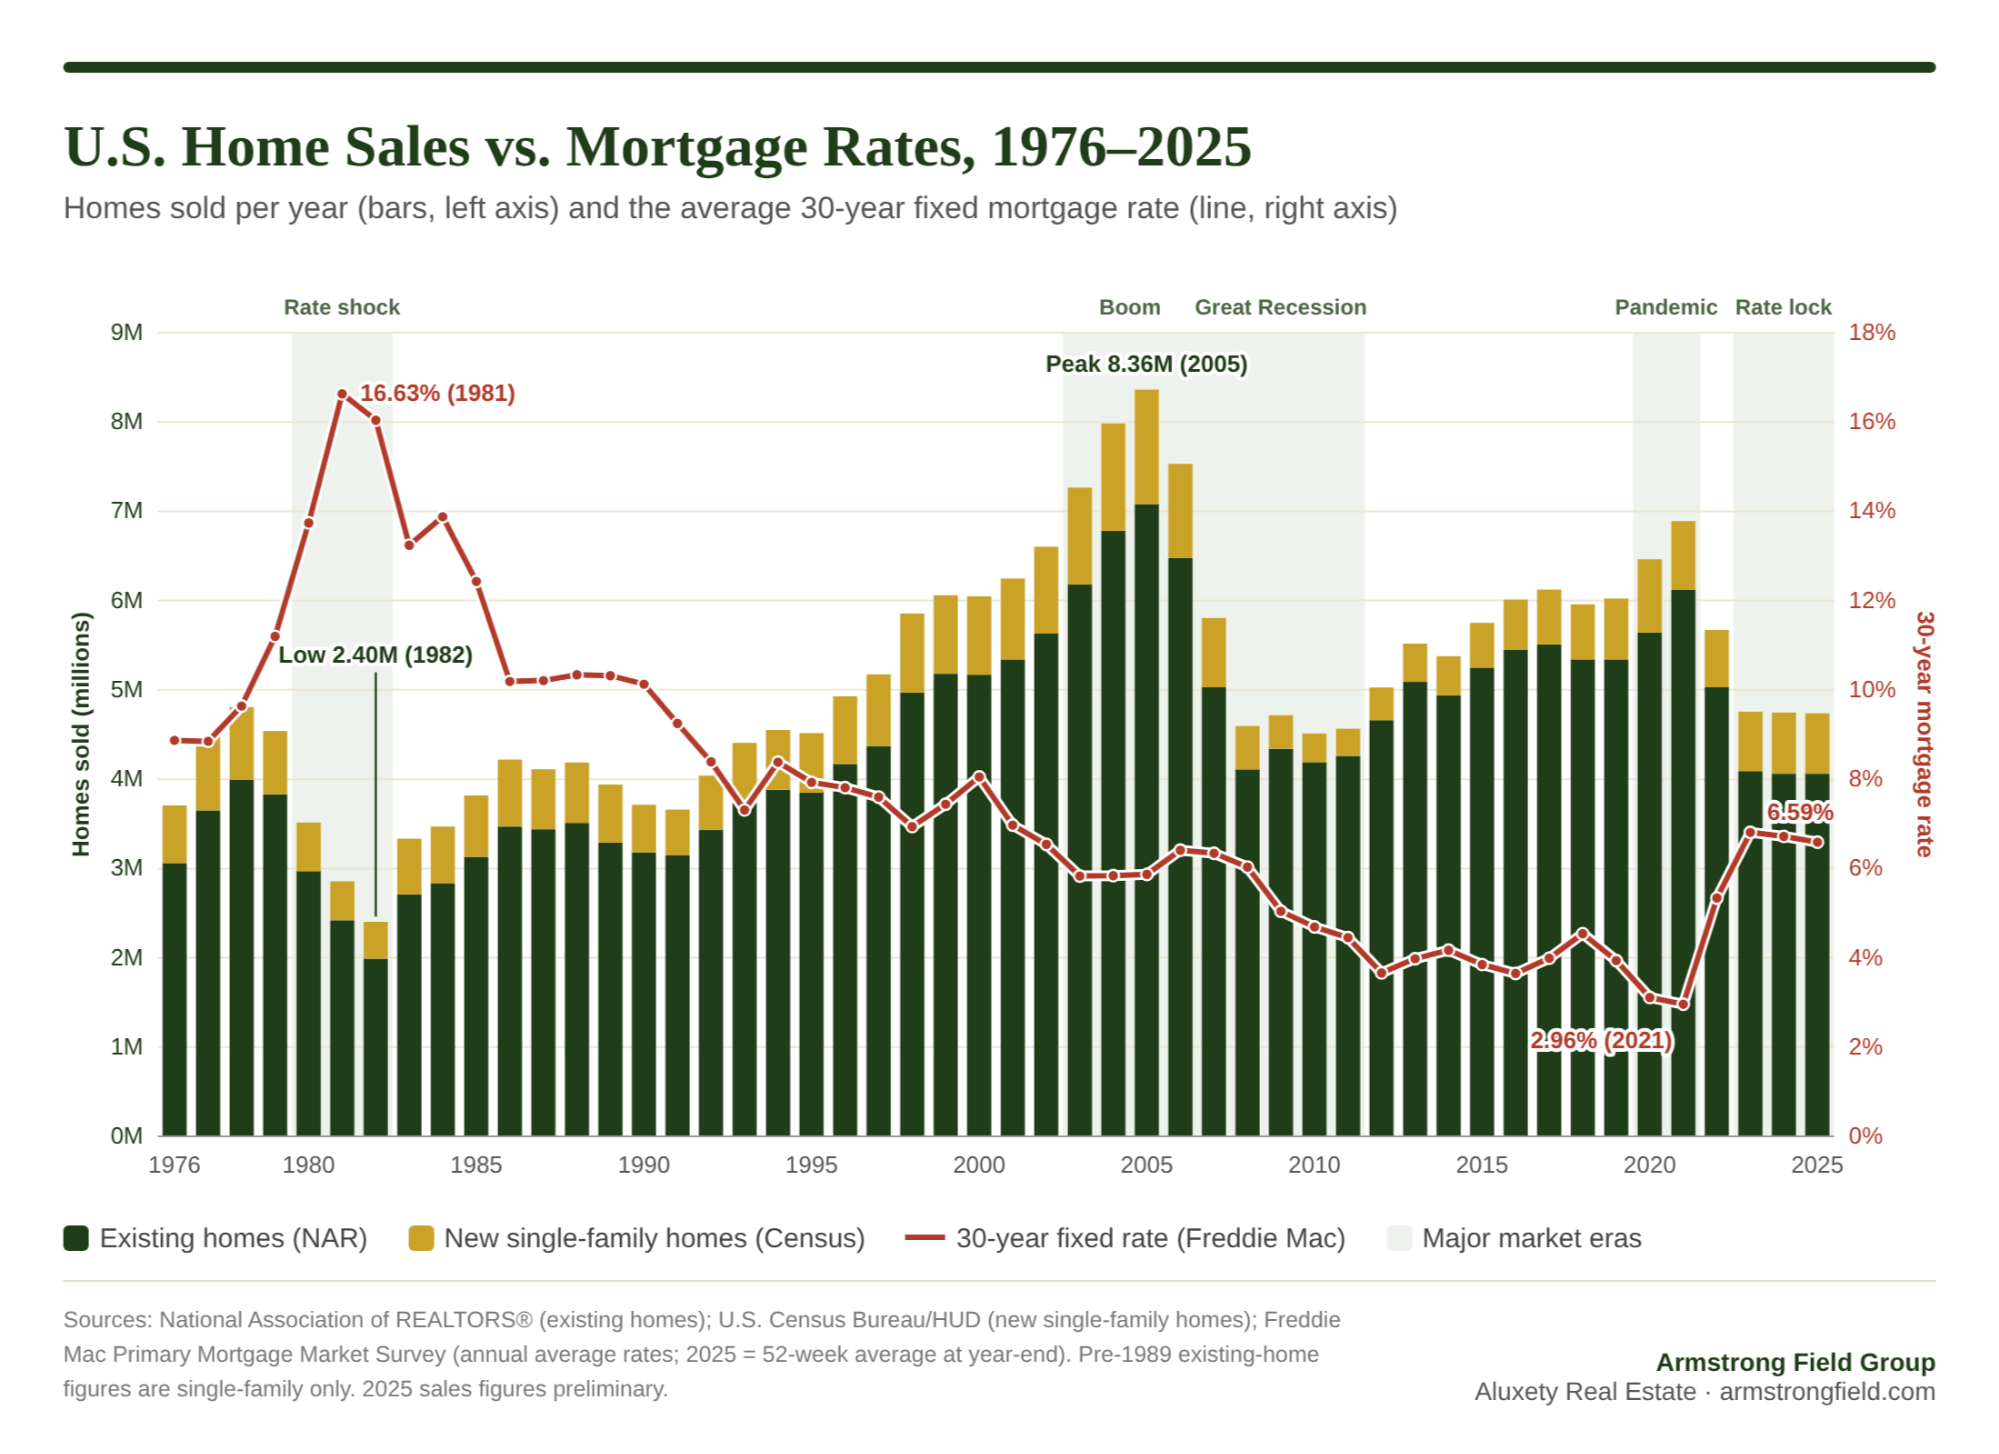
As a Massachusetts broker and real estate instructor, I find the long view is the best antidote to short-term noise. Here's 50 years of national home sales and mortgage rates in one chart. The full year-by-year numbers are in the data table further down.
Four Cycles in 50 Years, and the Rates Behind Them
1. The Volcker Rate Shock (1980–1982)
To break double-digit inflation, the Federal Reserve pushed interest rates to historic highs. The average 30-year mortgage rate climbed from 9.64% in 1978 to 16.63% in 1981, the highest yearly average on record. Existing-home sales fell to 1.99 million in 1982, the lowest point in the modern record. When rates eased to 13.24% in 1983, sales jumped 36% in a single year.
2. The Boom (2003–2006)
From 2003 through 2005, mortgage rates averaged under 6%, the lowest since Freddie Mac began tracking them in 1971. Combined with loose lending standards, that pushed sales to 7.08 million existing homes in 2005, plus nearly 1.3 million new homes. It's still the high-water mark.
3. The Great Recession (2007–2011)
This is the cycle that breaks the pattern. Rates fell from 6.34% in 2007 to 4.45% in 2011, yet existing-home sales dropped to about 4.1 million and stayed there. Cheaper money couldn't help when credit had frozen, lending standards tightened and foreclosures flooded the market. New construction bottomed at roughly 306,000 homes in 2011.
4. The Pandemic Surge and the "Rate Lock" (2020–2025)
Rates hit a record-low yearly average of 2.96% in 2021, and sales climbed to 6.12 million existing homes. Then rates more than doubled in two years, to 6.81% in 2023. Existing-home sales fell to 4.09 million that year and stayed near 4.1 million through 2025. Many owners who locked in rates around 3% have been reluctant to sell and take on a new loan at 6% to 7%, which is a big reason inventory has stayed tight.
What 50 Years of Rates Tell Us
- Speed matters more than level. Rates near 10% in the late 1980s still supported about 3.5 million existing-home sales a year. What hurts is a sudden jump, like 1979–81 or 2022–23, before buyers, sellers and prices have time to adjust.
- Falling rates help, but only when credit is flowing. 2008–2011 proved that low rates alone can't revive a market when lenders aren't lending.
- Today's rates aren't high by historical standards. The 2025 average of 6.59% is below the 50-year average. It only feels high compared with the unusually low rates of 2012–2021.
Signs of a Turn at the End of 2025
The year ended on a stronger note. Freddie Mac's 30-year rate averaged 6.59% over 2025 and finished the year at 6.15%, down from around 7% in January. In December 2025, existing-home sales ran at a seasonally adjusted annual pace of 4.35 million, the fastest since February 2023. One strong month isn't a trend, but history shows sales tend to respond when rates ease and stay down.
What This Means on the North Shore
National numbers set the backdrop, but real estate is local. Conditions in Beverly, Salem, Danvers, Marblehead, Peabody, Gloucester, and the rest of Essex County can look quite different from the national average, especially when it comes to inventory and pricing by town and price point.
- For sellers: Fewer homes on the market can mean less competition for well-priced, well-prepared listings. Pricing strategy matters more than ever.
- For buyers: A slower national pace doesn't automatically mean bargains locally. If rates continue to ease, competition could pick up, so knowing which towns and price ranges have more choice is where local expertise pays off. A local lender can also walk you through rate buydowns and refinancing options.
- For everyone: History shows that slow markets eventually turn. Making a decision based on your own timeline and finances, not the headlines, is usually the right call.
Frequently Asked Questions
How many homes were sold in the U.S. in 2025?
About 4.06 million existing homes, according to the National Association of REALTORS®, plus an estimated 679,000 new single-family homes, according to the U.S. Census Bureau. That's roughly 4.74 million homes in total.
When did U.S. home sales peak?
2005 was the record year, with 7.08 million existing-home sales and about 1.28 million new-home sales, for a combined total of roughly 8.36 million.
What was the worst year for U.S. home sales?
1982. Existing-home sales fell to 1.99 million as 30-year mortgage rates averaged about 16%. New-home sales also hit a decade low of 412,000 that year.
How do mortgage rates affect home sales?
Higher rates raise monthly payments, which reduces what buyers can afford and discourages owners with low-rate mortgages from selling. Over the past 50 years, the sharpest sales declines came when rates rose quickly, in 1979–1981 and 2022–2023. Rates aren't the only factor, though. In 2008–2011, rates fell and sales still stayed low because credit had tightened.
What was the highest mortgage rate in U.S. history?
The highest yearly average for a 30-year fixed mortgage was 16.63% in 1981, according to Freddie Mac. The lowest was 2.96% in 2021. The 2025 average was 6.59%.
Is the housing market crashing?
Sales volume has been low since 2023, but low volume isn't the same as a crash. Today's slowdown is driven mainly by limited inventory and affordability, not the wave of foreclosures that defined 2008. Local conditions vary, so the best answer for your situation comes from looking at your specific town and price range.
View the full data table: home sales and mortgage rates (1976–2025)
| Year | Existing (millions) | New (thousands) | Total (millions) | 30-Yr Rate |
|---|---|---|---|---|
| 2025 | 4.06 | 679 | 4.74 | 6.59% |
| 2024 | 4.06 | 686 | 4.75 | 6.72% |
| 2023 | 4.09 | 666 | 4.76 | 6.81% |
| 2022 | 5.03 | 641 | 5.67 | 5.34% |
| 2021 | 6.12 | 771 | 6.89 | 2.96% |
| 2020 | 5.64 | 822 | 6.46 | 3.11% |
| 2019 | 5.34 | 683 | 6.02 | 3.94% |
| 2018 | 5.34 | 617 | 5.96 | 4.54% |
| 2017 | 5.51 | 613 | 6.12 | 3.99% |
| 2016 | 5.45 | 561 | 6.01 | 3.65% |
| 2015 | 5.25 | 501 | 5.75 | 3.85% |
| 2014 | 4.94 | 437 | 5.38 | 4.17% |
| 2013 | 5.09 | 429 | 5.52 | 3.98% |
| 2012 | 4.66 | 368 | 5.03 | 3.66% |
| 2011 | 4.26 | 306 | 4.57 | 4.45% |
| 2010 | 4.19 | 323 | 4.51 | 4.69% |
| 2009 | 4.34 | 375 | 4.71 | 5.04% |
| 2008 | 4.11 | 485 | 4.60 | 6.03% |
| 2007 | 5.03 | 776 | 5.81 | 6.34% |
| 2006 | 6.48 | 1,051 | 7.53 | 6.41% |
| 2005 | 7.08 | 1,283 | 8.36 | 5.87% |
| 2004 | 6.78 | 1,203 | 7.98 | 5.84% |
| 2003 | 6.18 | 1,086 | 7.27 | 5.83% |
| 2002 | 5.63 | 973 | 6.60 | 6.54% |
| 2001 | 5.34 | 908 | 6.25 | 6.97% |
| 2000 | 5.17 | 877 | 6.05 | 8.05% |
| 1999 | 5.18 | 880 | 6.06 | 7.44% |
| 1998 | 4.97 | 886 | 5.86 | 6.94% |
| 1997 | 4.37 | 804 | 5.17 | 7.60% |
| 1996 | 4.17 | 757 | 4.93 | 7.81% |
| 1995 | 3.85 | 667 | 4.52 | 7.93% |
| 1994 | 3.88 | 670 | 4.55 | 8.38% |
| 1993 | 3.74 | 666 | 4.41 | 7.31% |
| 1992 | 3.43 | 610 | 4.04 | 8.39% |
| 1991 | 3.15 | 509 | 3.66 | 9.25% |
| 1990 | 3.18 | 534 | 3.71 | 10.13% |
| 1989 | 3.29 | 650 | 3.94 | 10.32% |
| 1988 | 3.51 | 676 | 4.19 | 10.34% |
| 1987 | 3.44 | 671 | 4.11 | 10.21% |
| 1986 | 3.47 | 750 | 4.22 | 10.19% |
| 1985 | 3.13 | 688 | 3.82 | 12.43% |
| 1984 | 2.83 | 639 | 3.47 | 13.88% |
| 1983 | 2.71 | 623 | 3.33 | 13.24% |
| 1982 | 1.99 | 412 | 2.40 | 16.04% |
| 1981 | 2.42 | 436 | 2.86 | 16.63% |
| 1980 | 2.97 | 545 | 3.52 | 13.74% |
| 1979 | 3.83 | 709 | 4.54 | 11.20% |
| 1978 | 3.99 | 817 | 4.81 | 9.64% |
| 1977 | 3.65 | 819 | 4.47 | 8.85% |
| 1976 | 3.06 | 646 | 3.71 | 8.87% |
Categories
- All Blogs (193)
- Beverly, MA (13)
- Buying a Home (92)
- Condos For Sale (6)
- Danvers, MA (2)
- Estates & Inherited Homes (3)
- Gloucester, MA (1)
- Home Ownership (49)
- Home Sellers Guide (18)
- Homes For Sale (10)
- Ipswich, MA (2)
- Jim Armstrong (1)
- Landlords (1)
- Living on the North SHore (30)
- Mortgages (15)
- Peabody, MA (1)
- Prospective Real Estate Agents (1)
- Real Estate Careers (7)
- Real Estate Market Conditions (43)
- Real Estate School (2)
- Renting (1)
- Salem, MA (14)
- Selling a home (100)
- Senior Living (2)
- Swampscott, MA (1)
Recent Posts